eBPF - eBPF in Action Using BCC

Abstract
After explaining the working of eBPF and its architecture, now we are going to try some eBPF programs to see and know what kind of operations and syscalls we can execute using it.
Using BCC ( # BPF Compiler Collection)
As already explained on the last 2 articles I wrote about eBPF,
BCC is a toolkit for creating efficient kernel tracing and manipulation programs, and includes several useful tools and examples. It makes use of extended BPF (Berkeley Packet Filters), formally known as eBPF, a new feature that was first added to Linux 3.15. Much of what BCC uses requires Linux 4.1 and above.
Kernel Configuration
In general, to use these features, a Linux kernel version 4.1 or newer is required. In addition, the kernel should have been compiled with the following flags set:
1 | CONFIG_BPF=y |
There are a few optional kernel flags needed for running bcc networking examples on vanilla kernel:
1 | CONFIG_NET_SCH_SFQ=m |
You can check the Kernel compile flags by copying & extracting the
/proc/config.gzand checking the containingconfigfile
Execute this command to check the flags on your Kernel.
1 | cd /tmp && cp /proc/config.gz . && gzip -d config.gz && cat config |
Installation
You can check the whole installation process here : BCC Install

Tracing Examples
:warning: : Using those scripts needs root permission to work properly
Trace a Block I/O size
using BiteHist.py

Trace block device I/O latency
using DiskSnoop.py

Trace IPv4 and IPv6 bind() system calls
using bindsnoop.py

Capturing Examples
Capture new processes via exec() syscalls.
using execsnoop.py

Those are the executed commands on my computer in loop for Polybar scipts**
Capturing open() syscalls (file opening)
using opensnoop.py

Capturing TCP active connections (connect())
using tcpconnect.py

And much more…
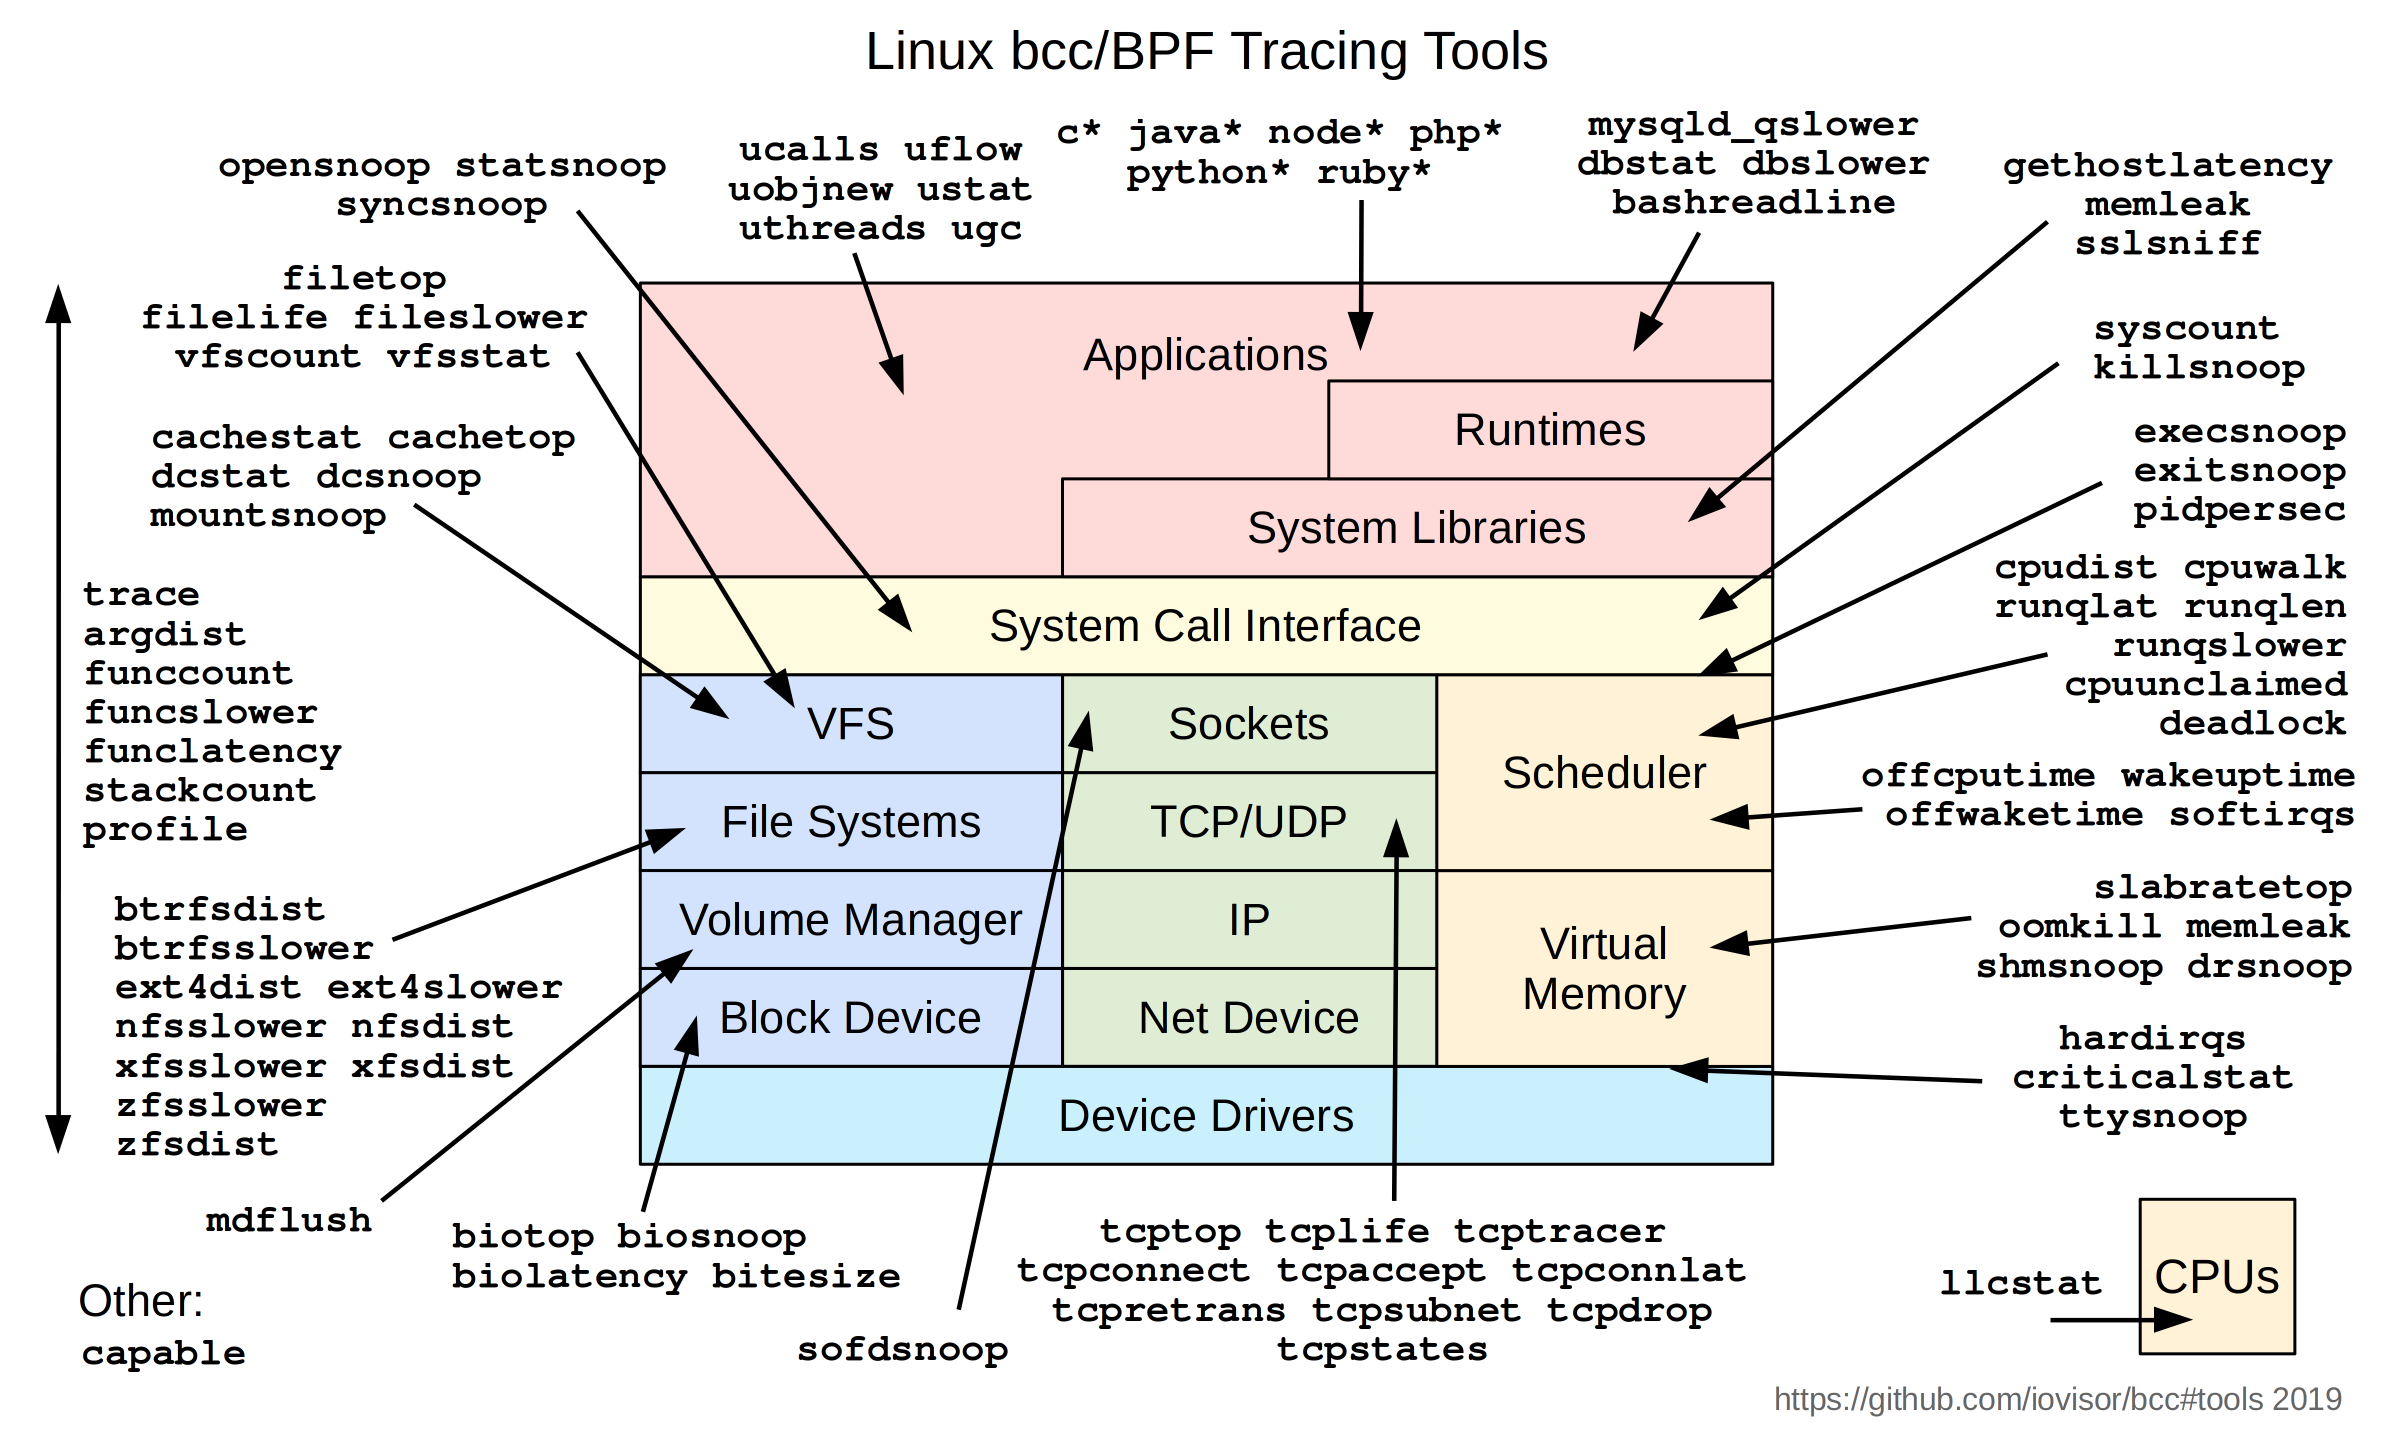
check the whole BCC Tools Pack BCC Tools
here is a picture explaining the different BCC Tracing tools / BPF programs.
So now, you do understand and know how BPF, eBPF and BPF programs work.
For better and more much scalable solutions, you will have to :
Develop your own BPF programs and tools.
Use Open Source projects already working with full functional structure for each fonctionality.
Use paid products and solutions.
We’ll try exploring all of this on the next articles.
© 2022 - Sofiane Hamlaooui - Making the world a better place 🌎